Result Viewer
The FRICOSIPY result viewer is a Jupyter Notebook interactive workbook that contains a few plotting functions to help visualise results of the model. It is designed to provide a few examples of how to manipulate Network Common Data Format (NetCDF) files using the Xarray python computing package and provide greater accessibility to those less familiar with programming.
Visualising an Xarray Dataset
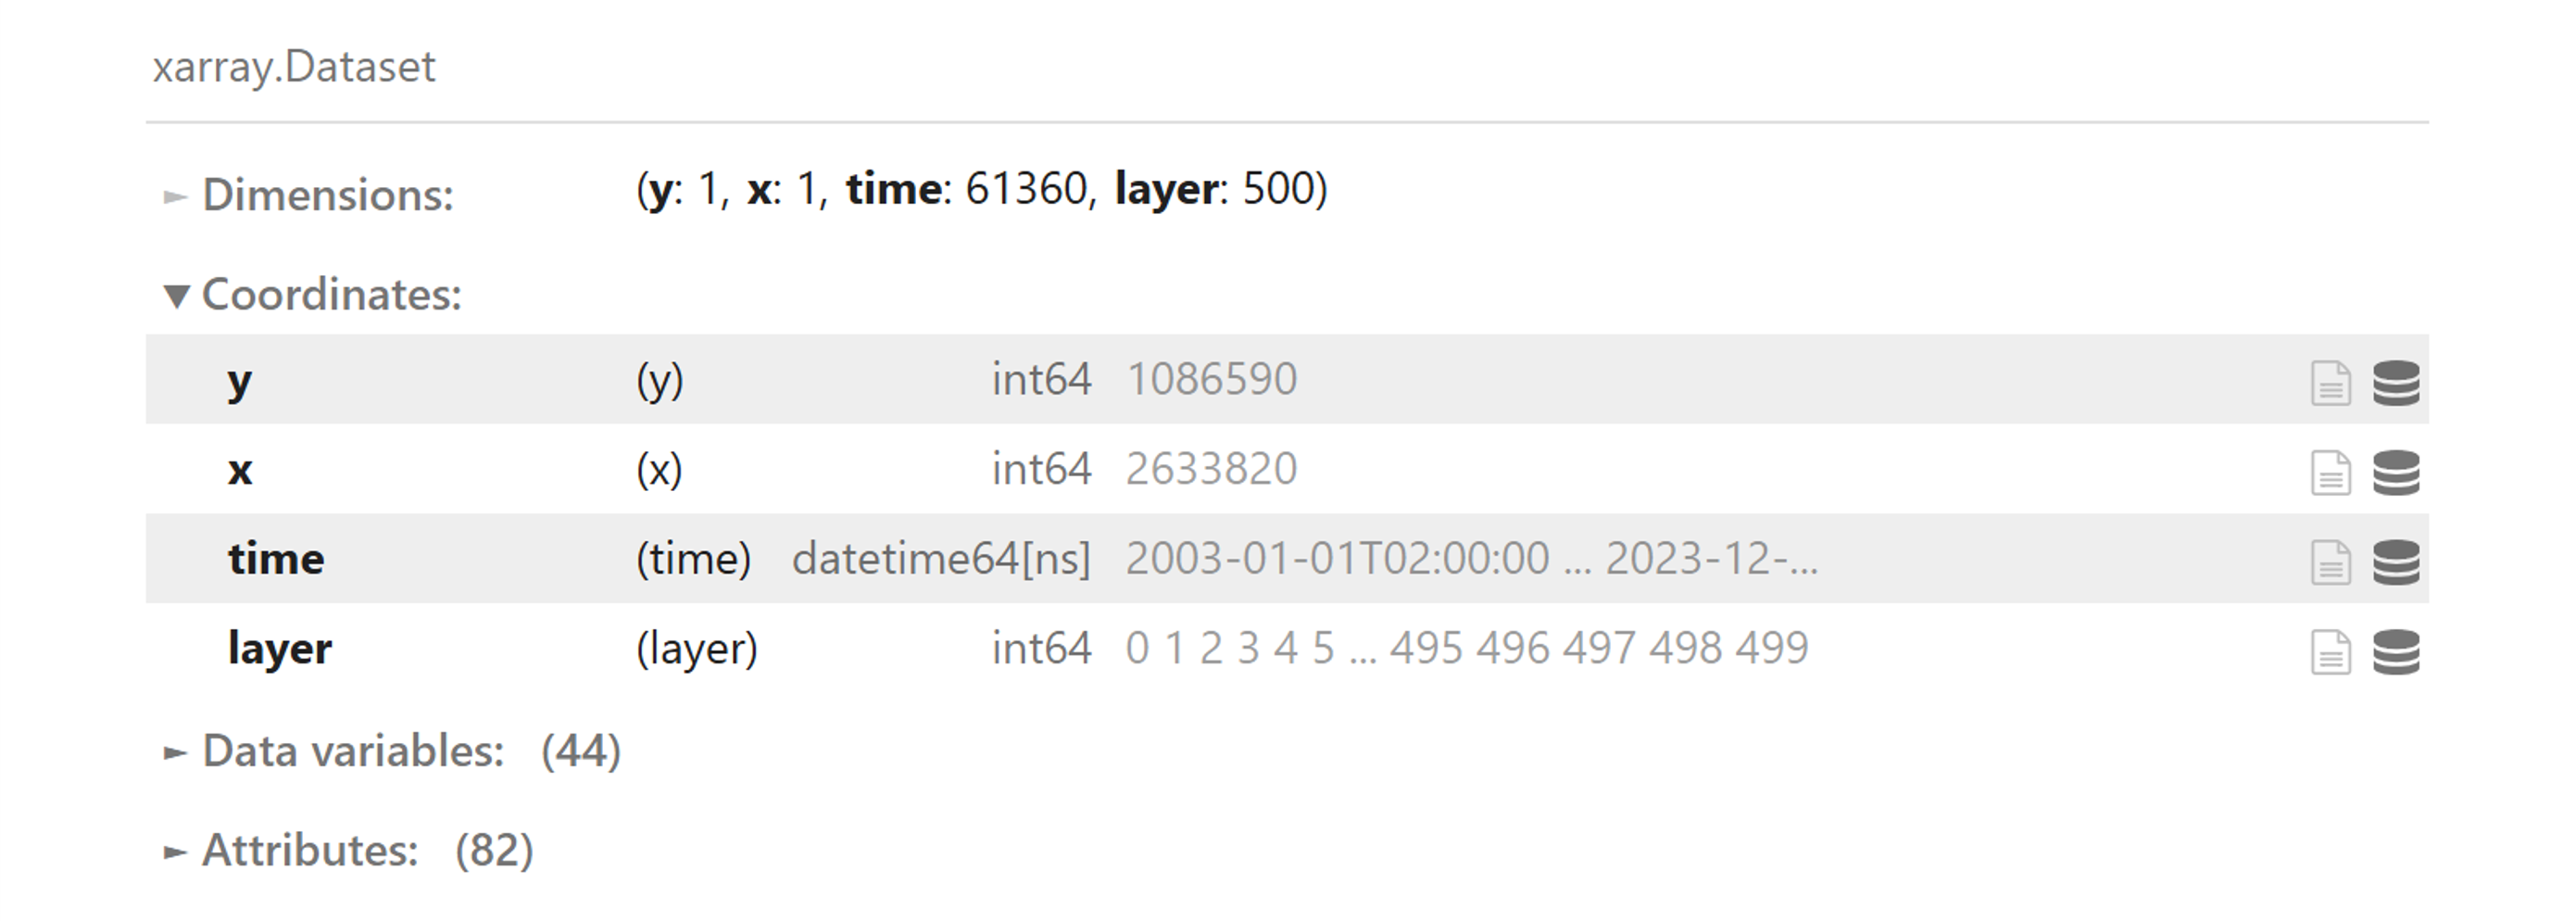
FRICOSIPY output files are visualised using the standard Xarray dataset. The dataset is structured in 4 dimensions with the following co-ordinates:
- y – \(y\) co-ordinate of spatial node (northing) [m]
- x – \(x\) co-ordinate of spatial node (easting) [m]
- time – datetime value [yyyy-mm-dd hh:mm]
- layer – subsurface layer [n]
Selecting the data variables tab will reveal the names and details of all output variables. Each can be selected by typing the dataset name ( ds ) followed by a period ( . ) and the exact name of the desired output variable ( eg. ds.SHORTWAVE will access the net shortwave radiation data ).
Selecting the attributes tab will reveal a list of all the parameterisation choices and the values selected for all simulation paramters.
Note
If the user disabes the reporting of the subsurface variables ( full_field = False in config.py ), the dataset will be reduced to 3 dimensions excluding the layer co-ordinate.